Hello golf stakeholders:
With the US Open now completed (what a finish) and the Open Championship approaching to conclude the season’s majors, for operators and those tied to the success of “played” vs. “watched” golf we’re now in peak golf month nationally (~15% of annual rounds) and, when the month ends we’ll have accounted for ~59% of this calendar year’s rounds. To borrow and paraphrase from the PGA TOUR, Jun-Aug are the “moving months” for those in golf operations at the national level.
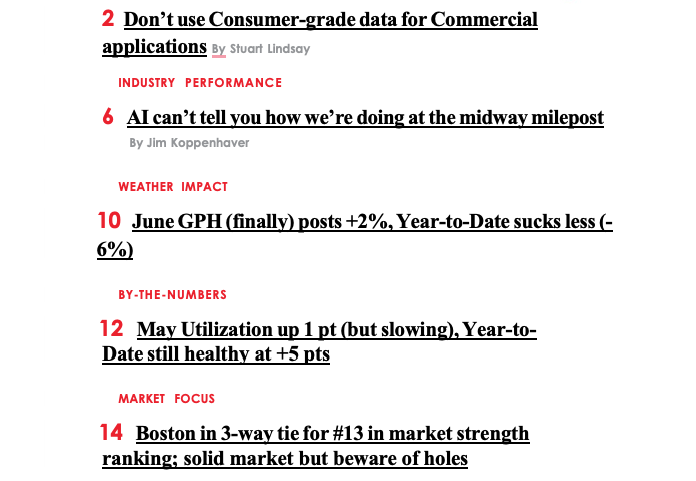
Contributing Editor Stuart Lindsay channels the brains behind our weather impact who recently posited on LinkedIn that he often sees businesses use consumer-grade weather for commercial-grade applications and why that repeatedly fails to deliver accurate and actionable insights. Stuart’s net assessment? After 15+ years of developing and refining weather impact with one of the smartest partners in that space with the most robust data, if operators can better figure it out using their limited knowledge in this area with inconsistent data as their 10th part-time job, then both parties are in the wrong line of business (they should be in the commercial insights business and we should not).
Building on Stuart’s mantra of “You cannot have an intelligent discussion of golf course performance without weather impact”, Publisher Jim K. scorecards the industry’s performance through June using our Golf Market Research Center scorecard of 7 KPIs and the aggregated results submitted by our participants at the halfway mark of the year. Compared to what the industry quantitatively knows and in the public domain (Rounds -1% through May nationally), he takes you through the cardinal metrics of Golf Revenue-per-Available Round (GRevpAR) and Utilization as well as Golf Revenue, Rounds, Rate Change and Discount Rate. GMRC participants had this information exclusively for their facility, the participating markets and the portfolio in total the first week of July; perhaps at some time in the future the industry as a whole will embrace performance measurement at scale in near-time and, if we live long enough, benchmarking that includes sample distribution and facility type balancing to be representative of the nation and major markets; we can dream.
See below for the headlines to each of our recurring sections from the regional June weather impact (yay, 1st “up” month of the year) to By-the-Numbers which provides the May and Year-to-Date results for Rounds (slight off) and Utilization (slight up). We’ve already compiled the June golf operations performance scorecard “preview”, courtesy of our Golf Market Research Center (GMRC) early-responders, and the sneak peek suggests that Rounds will be up slightly but lag the favorable weather (Utilization decline). If you want to know those numbers on a regular basis, you can either participate in GMRC (course operators) or sign up for a Publications Membership (everyone else).
If you know of associates who would benefit from the topics and insights covered in this issue, feel free to forward this email and encourage them to register on the Pellucid website (http://www.pellucidcorp.com/news/elist) to join the discussion and healthy debate.
© Copyright 2025 Pellucid Corp. All rights reserved. Quotations permitted with prior approval. Material may not be reproduced, in whole or part in any form whatsoever, without prior written consent of Pellucid Corp.
